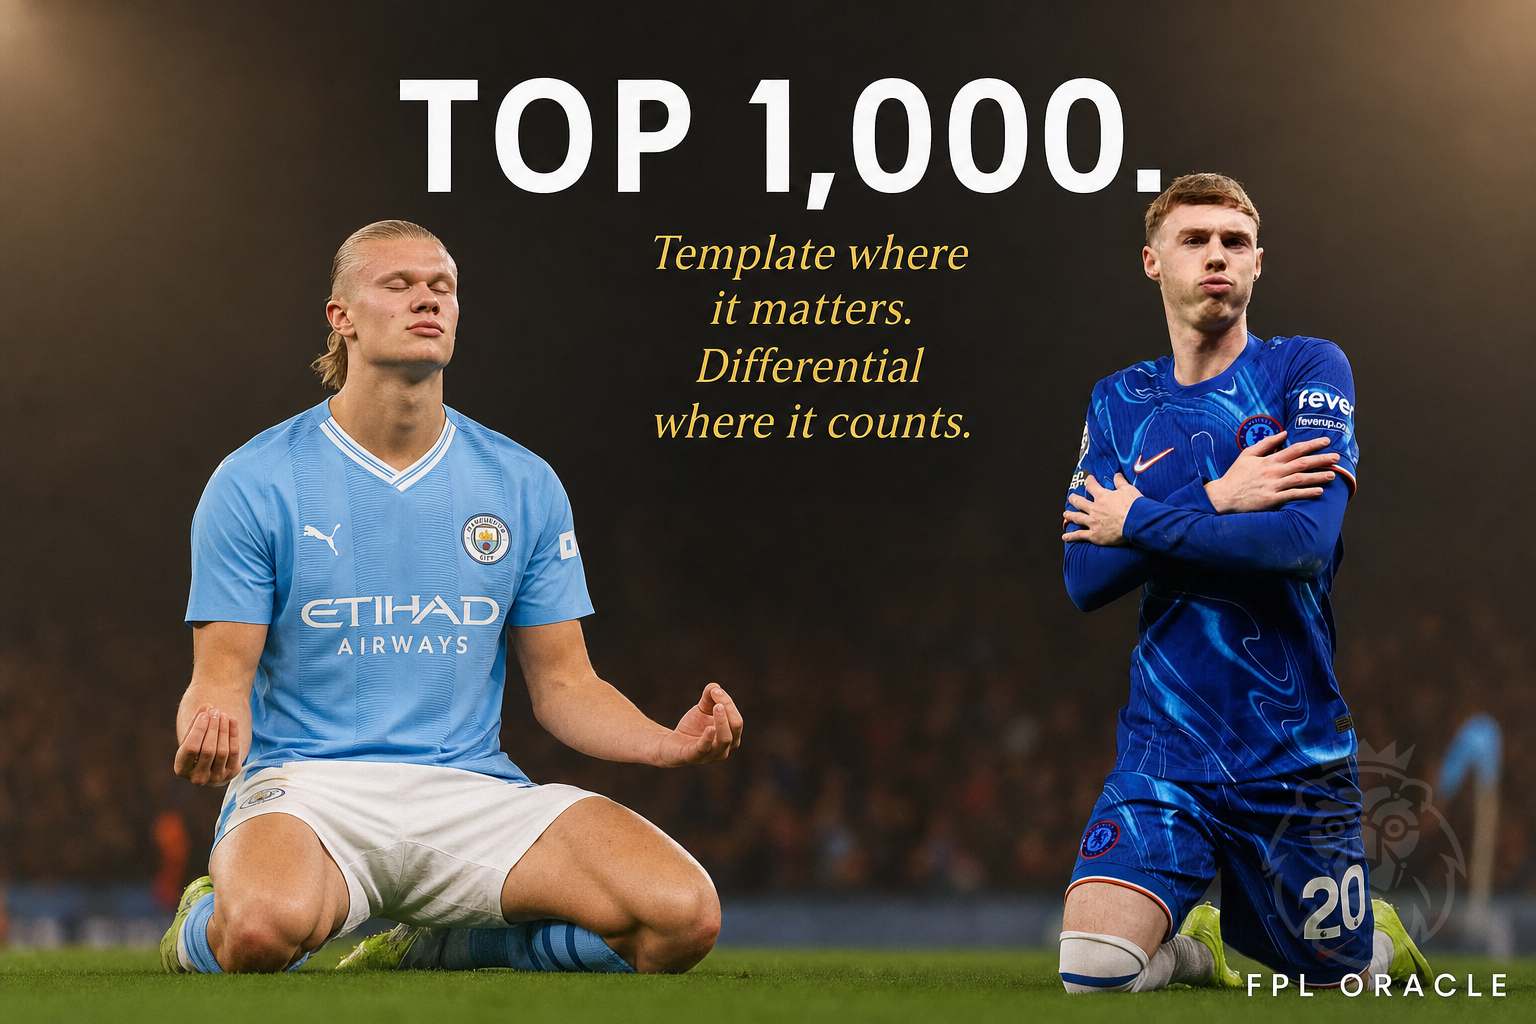
Top 10k gets talked about constantly in FPL content. Top 1,000 barely gets mentioned — because it is a genuinely tiny, genuinely elite slice of the game, and pulling reliable data on it requires actually tracking those specific managers rather than guessing. But it is the single most useful benchmark that exists, because the top 1,000 is where every marginal decision has already been optimised. Nobody in that tier is winging it. This is a breakdown of what actually separates a top 1,000 squad from a top 100k squad — in ownership structure, budget allocation, captaincy discipline, and chip timing — based on the patterns that repeat season after season at the very top of the game.
Why Top 1,000 Is a Different Benchmark to Top 10k
The top 10,000 is roughly 0.1% of the active player base and already represents an outstanding season. The top 1,000 is ten times smaller again — roughly the top 0.01%. At that level, the sample is small enough that individual skill and consistent process dominate any residual luck. A manager can have a lucky season and land in the top 10k. Landing in the top 1,000 almost always requires a full season of correct decisions compounding, because a single catastrophic gameweek is very difficult to recover from against a field that good.
This matters for what you can actually learn from watching this tier. Top 10k patterns include some noise — managers who got one huge captaincy call right and rode it. Top 1,000 patterns are closer to signal. What repeats at that level is what actually works, not what got lucky once.
Ownership Structure: More Differentiated Than You'd Expect
The common assumption is that the very best managers all own the same "correct" template. The reality is closer to the opposite. Top 1,000 squads typically carry 2 to 3 more genuine differentials in their starting XI than a top 50k squad does — players outside the gamewide top-20 ownership bracket who are backed by strong underlying data rather than reputation.
This lines up with the mathematics covered in our guide to template vs differential decision-making: managers who only ever own the template can only ever track the field, never beat it decisively. To reach the top 1,000 specifically, you need moments across the season where your squad diverged from the pack and paid off. The top 1,000 is not full of reckless punts, though — the differentials they carry are backed by consistent xGI, favourable underlying fixtures, or a clear role change that the wider market has not priced in yet.
Where top 1,000 squads do converge with the template: goalkeeper and the most secure premium defensive assets. There is little rank-differentiating value in a contrarian goalkeeper pick, so even elite managers cluster here. Differentiation happens overwhelmingly in midfield and attack, where the points swings are largest.
Budget Allocation: The Premium-Heavy Skew
Top 1,000 squads consistently run a heavier premium allocation than the average top 100k squad — typically 2 to 3 attacking assets priced above £10m, funded by a genuinely disciplined budget structure in defence. This connects directly to the DefCon dynamics covered in our DefCon farming guide: elite managers use the new defensive contributions scoring to run cheaper, defensively reliable picks at the back, freeing up budget to stack two or three genuine premium attacking differentials rather than spreading funds thin across the pitch.
The pattern is not about spending recklessly on premiums — it is about disciplined budget engineering everywhere else specifically so the attacking third of the pitch can carry real weight. A top 1,000 squad rarely has more than one true "budget enabler" defender who exists purely to free up funds with no attacking upside expected.
Elite managers build team value with a destination in mind rather than for its own sake — the difference between the two is most of what separates useful value from busywork.
Captaincy Discipline: Fewer Changes Than You'd Think
One of the more counter-intuitive patterns at the top level is how rarely elite managers change their captaincy heuristic week to week. This does not mean they always captain the same player — it means they apply the same decision process consistently, rather than chasing the last week's winner or reacting emotionally to social media sentiment in the hours before deadline.
The full captaincy framework that top-tier managers apply, even if they have never written it down explicitly, is covered in our complete captaincy decision framework. What separates top 1,000 captaincy from top 100k captaincy is not more research — it is more consistency in applying the same research process every single week, including in the weeks when the popular pick and the process-driven pick disagree.
Chip Timing: Planned Months in Advance
Top 1,000 managers almost never play chips reactively. Their Bench Boost and Triple Captain usage clusters tightly around double gameweeks that were identifiable weeks in advance, and their Wildcards are timed to specific fixture swing points rather than triggered by a single bad gameweek. Under the new 2025/26 two-of-each system, this planning discipline matters even more, because there are twice as many chip decisions to sequence correctly across the season — covered fully in our complete guide to the new chip system.
Rank-Mode Awareness
The clearest behavioural difference between top 1,000 and everyone else is that elite managers visibly shift their risk posture as the season progresses and their rank solidifies. Early-season top 1,000 squads often look aggressive and differential-heavy. By the closing gameweeks of a season where they have secured an elite rank, the same managers noticeably tighten up — captaincy converges toward the highest-EO pick, transfers become more conservative, and chip usage (if any chips remain) becomes highly selective. This is exactly the mode-switching behaviour mapped out in our rank protection vs rank climbing guide — the top 1,000 do not play one static style all season, they play the mode their rank situation calls for.
How to Actually Compare Your Squad Against This Tier
Reading about top 1,000 patterns is useful, but it is far more useful to see exactly where your own squad diverges from them right now. That comparison used to require manually cross-referencing team reveals and forum posts. It does not anymore.
FPL Oracle's Squad Comparison tool lets you benchmark your actual squad directly against the top 1k tier average — same 15 players, same budget allocation logic, same captaincy pattern analysis described in this article, but run against your specific team rather than a general description. It surfaces exactly which positions you are under-differentiated in, where your budget allocation diverges from the elite pattern, and whether your captaincy history has been converging or diverging from the top-tier process.
The top 1,000 is not full of reckless gamblers who got lucky, and it is not full of cautious template-followers either. It is a tier defined by disciplined differentiation — calculated divergence from the field in exactly the positions where it pays off most, backed by a consistent process rather than a single lucky punt.
The template core at the very top of the game is narrow and heavily concentrated. Players like Haaland and Fernandes sit in a large share of top-1k squads specifically because their underlying output has been genuinely elite, not just popular — while a premium like Saka, owned less at the very top tier than his gamewide ownership might suggest, shows exactly where elite squads have already diverged from the template most of the game is still following.
If you'd rather benchmark against the people you're actually playing than an abstract tier, you'll need your league ID instead of a rank target. Finding it takes about ten seconds.
The Oracle Takeaway
The top 1,000 FPL managers are not playing a mysterious, unknowable game. Their squads consistently show more midfield and attacking differentiation than the wider top 100k, a disciplined defensive budget freed up by DefCon-aware picks, a consistent rather than reactive captaincy process, and chip timing planned around structural fixture windows rather than triggered by single bad weeks.
Three actions to take from this: audit your own squad for where you are pure template versus where you carry genuine backed differentials, particularly in midfield. Check whether your defensive budget is optimised for DefCon returns or just spread thin out of habit. And be honest about whether your captaincy approach this season has been a consistent process or a reactive one.
Compare your squad directly against the top 1k tier with FPL Oracle and see exactly where the gap is — not in the abstract, but position by position, against your real 15 players.
Where do you think your squad diverges most from a top 1,000 team right now — differentiation, budget structure, or captaincy discipline? 👇