Most FPL content treats xG, xA, and xGI as glossary entries — a definition, maybe a top-10 list, and nothing else. That is a wasted opportunity, because these three numbers are not just descriptive. Read correctly, they are a forecasting tool: a genuine regression signal that tells you which players are about to cool off and which are quietly building toward a haul their raw goal and assist numbers have not caught up to yet. This guide explains what each stat actually measures, then goes further than almost any competitor explainer by showing you exactly how to use the gap between expected and actual output to make better transfer decisions.
What xG, xA and xGI Actually Measure
Expected Goals (xG) assigns a probability to every shot based on where it was taken from, the type of chance, and defensive pressure at the moment of the shot — built from historical data on thousands of similar shots. As Opta Analyst explains, xG measures the quality of a chance by calculating the statistical likelihood it results in a goal, using patterns from a huge sample of past shots rather than the outcome of any single attempt. A shot assigned 0.1 xG is the kind of chance that finds the net roughly 1 time in 10 across the full data set. It is not a prediction of what happened — it is a measure of what should happen on average, given the quality of the chance created.
Expected Assists (xA) applies the same logic to the pass that created the chance — measuring the probability that a given pass results in a goal, based on the quality of the chance it set up. Expected Goal Involvement (xGI) is simply xG plus xA combined: a single number capturing a player's total involvement in high-quality chances, whether he is the one shooting or the one creating.
The "So What" Most Explainers Skip: Reading the Gap
Here is the part that turns xGI from a glossary entry into an actual decision-making tool. Every player has two numbers running in parallel: his actual goals and assists, and his underlying xG and xA. When those two numbers diverge significantly, that gap is information — and it points in a specific, usable direction.
A player scoring well above his xG is a sell-high signal. If a striker has scored 9 goals from an xG of 5.2, he has been significantly more clinical than the quality of his chances would predict on average. This can happen — some players are genuinely elite finishers who beat their xG consistently across a career. But for most players, a large positive gap over a meaningful sample (6+ gameweeks) tends to regress toward the mean. His actual scoring rate is likely to slow down even if his underlying chance quality stays exactly the same, simply because the finishing variance that inflated his goal count is unlikely to persist at the same rate.
A player underperforming his xG is a genuine buy-low candidate. The inverse case is where the real edge lives. A midfielder who has created chances worth 6.5 xG but has only 2 actual goals to show for it has been unlucky, not bad. His underlying process — the quality and volume of chances he is getting into — is exactly what you want. The market, which prices players heavily on actual returns rather than underlying data, has not caught up yet. This is precisely the gap a data-aware manager can exploit before wider ownership catches on.
Reading xGI Per 90, Not Just Season Totals
Raw season xGI totals are distorted by minutes played, which makes them a poor way to compare two players directly. A player with 4.0 season xGI from 900 minutes is a completely different proposition to a player with the same 4.0 xGI from 2,700 minutes. Always convert to xGI per 90 minutes before making a comparison — this normalises for playing time and gives you the true rate of underlying output regardless of whether a player has missed matches through rotation or injury.
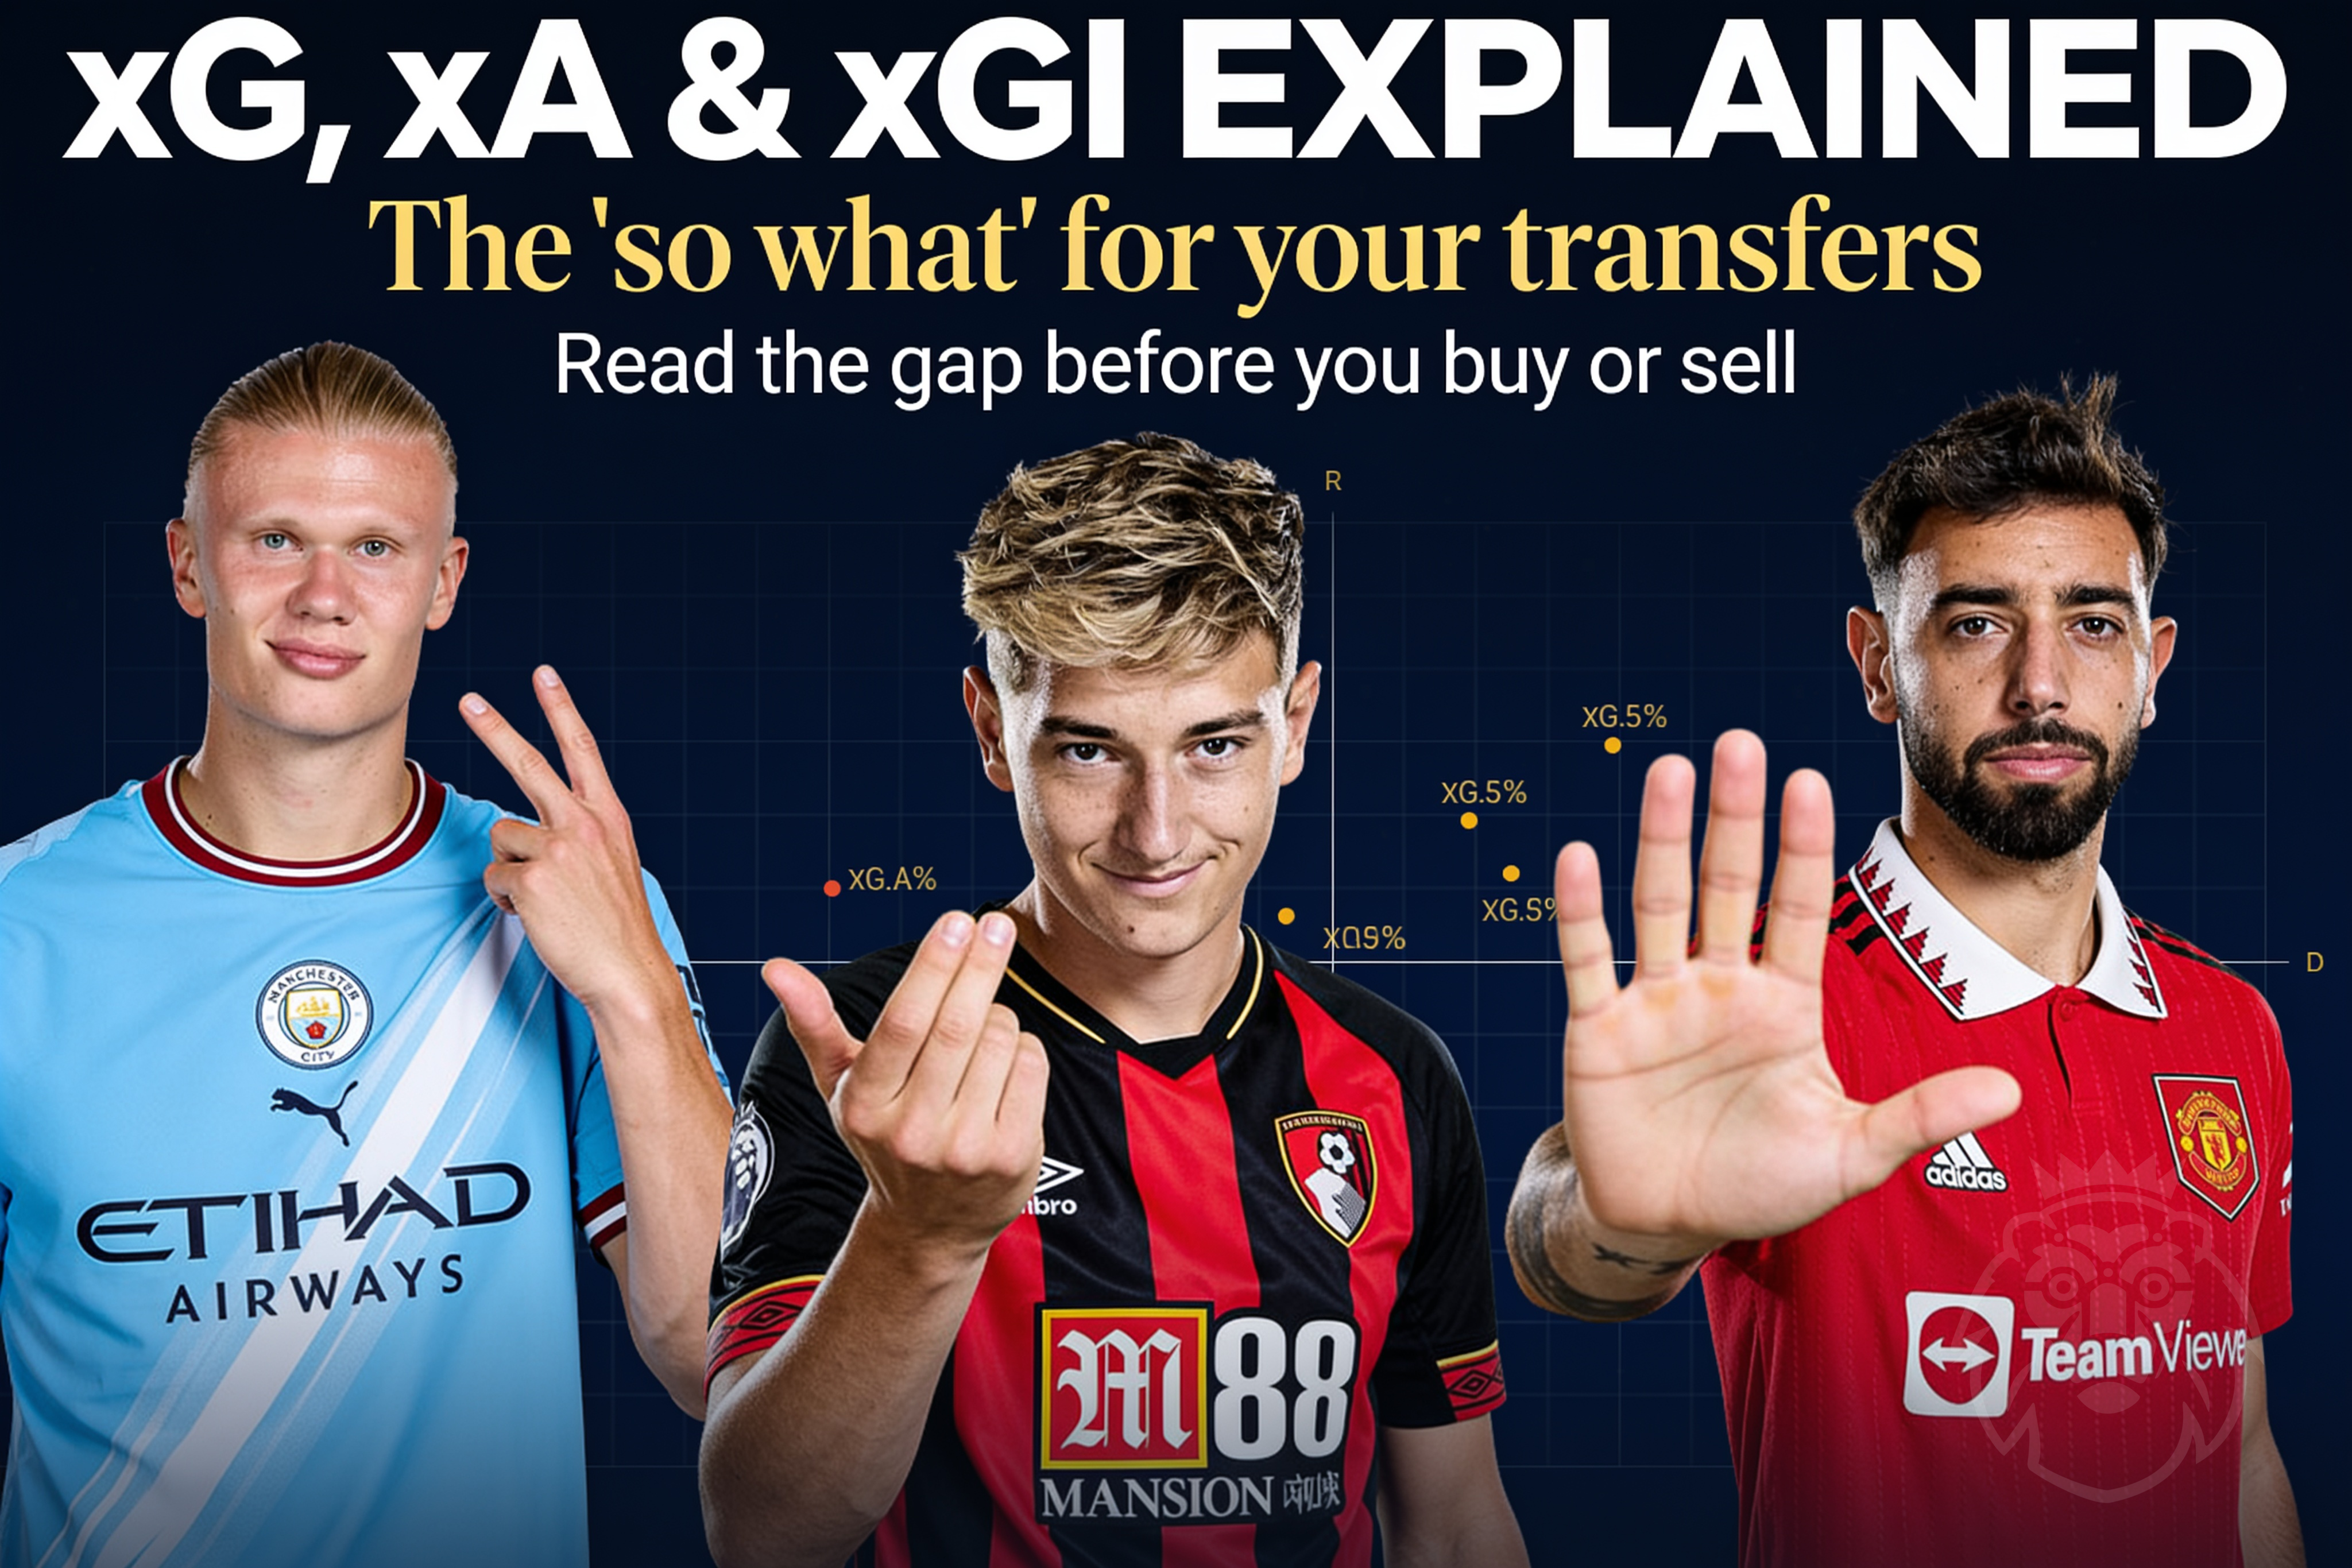
Live examples make the pattern clearest. Haaland is currently posting 0.86 xGI per 90 — an elite number built almost entirely through raw shot volume and threat in the box, the profile you would expect from a penalty-area striker. But xGI is not just a premium-player metric. Brooks is currently at 0.70 xGI per 90 from a genuinely budget price point — proof that elite underlying output exists well outside the premium bracket if you know to check the per-90 rate rather than assuming reputation and price track quality perfectly. And the shape of xGI matters as much as the number: Fernandes' 0.68 xGI per 90 is a creative-midfielder profile, built predominantly through xA rather than xG — a different kind of output than a pure striker's, and one that behaves differently week to week depending on how his team creates chances rather than how often he shoots.
Why the Profile Shape Matters as Much as the Total
Two players can post an identical headline xGI number through completely different underlying compositions, and that composition changes how reliable the number is going forward. A striker whose xGI is almost entirely xG-driven is dependent on staying the primary shooter in his team's attack — a tactical change or a new signing ahead of him in the pecking order can collapse his output fast. A creative midfielder whose xGI leans heavily on xA is dependent on his team generating chances at all — if his team's attack goes cold collectively, his xA contribution drops even if his individual passing quality has not changed.
This is why checking the xG-to-xA split within a player's xGI total is worth the extra thirty seconds before a transfer decision. A balanced xGI, built from both categories, tends to be the most durable profile — it does not depend on a single mechanism continuing to function exactly as it has.
Using xGI to Validate a Differential — Not Just Spot One
xGI per 90 is also the primary tool for confirming whether a low-owned player is a genuine differential or just an unpopular one for good reason. As covered in our guide to finding real FPL differentials, low ownership by itself tells you nothing about quality — it is a market signal, not a performance signal. A player with rising xGI per 90 and falling ownership is exactly the divergence that makes a differential worth taking. A player with falling xGI and falling ownership is the market correctly adjusting, and following him in is a trap dressed up as contrarian thinking.
Using xGI in Your Captaincy Decision
xGI per 90, weighted by upcoming fixture quality, is one of the core inputs in a proper captaincy process — covered in full in our complete captaincy decision framework. The specific application here: use recent xGI (last 6 gameweeks) rather than season-long xGI when building your captaincy shortlist, since recent underlying output is a better predictor of next week's performance than a number that includes form from months ago. A captain candidate whose actual returns look modest but whose recent xGI is climbing is often a better forward-looking pick than one whose actual returns look strong but whose recent xGI has quietly started declining.
xGI captures goal threat and chance creation specifically, but it is not the whole picture of a player's influence on a match — for the broader composite view, see our ICT Index breakdown, which decomposes overall match influence into its Threat, Creativity, and Influence components.
xG and xA don't tell you what happened. They tell you what should have happened on average — and the gap between the two is the single most useful piece of information for spotting who's about to get better and who's about to get worse, well before the actual goals and assists catch up.
The Oracle Takeaway
xG, xA, and xGI are forecasting tools, not just descriptive stats. The single most valuable habit: check the gap between a player's actual output and his underlying xG/xA before every transfer decision. A large positive gap (overperforming) is a caution sign that regression is likely. A large negative gap (underperforming) is often the clearest buy-low signal available in the game.
Three actions to take this week: convert any player you are considering to xGI per 90, not season totals, so you are comparing like for like regardless of minutes played. Check the xG-to-xA split within that number to understand whether his output depends on shooting or creating, and how durable that mechanism is likely to be. And before committing to a differential, confirm his underlying xGI trend actually supports the move rather than just his falling ownership.
Every player page on FPL Oracle surfaces live xGI per 90 alongside the underlying xG/xA split, and Oracle's predicted points already factor this data directly into every recommendation it gives you. Check any player's live xGI on the Player Hub, or ask FPL Oracle directly whether your next transfer target is genuinely underperforming his underlying numbers or just having a run of bad luck that is about to end.
Have you ever sold a player right before his underlying numbers finally converted into actual returns? What did you miss at the time? 👇